Profile of the Running ES Score & Positions of GeneSet Members on the Rank Ordered List
| Dataset | Set_03_absentNotch_versus_truncNotch.phenotype_absentNotch_versus_truncNotch.cls #absentNotch_versus_truncNotch.phenotype_absentNotch_versus_truncNotch.cls #absentNotch_versus_truncNotch_repos |
| Phenotype | phenotype_absentNotch_versus_truncNotch.cls#absentNotch_versus_truncNotch_repos |
| Upregulated in class | absentNotch |
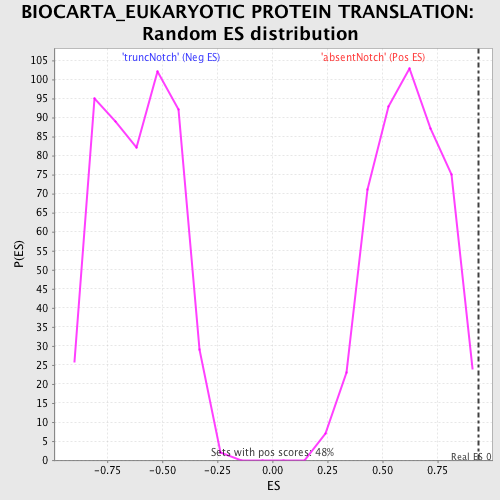
| GeneSet | BIOCARTA_EUKARYOTIC PROTEIN TRANSLATION |
| Enrichment Score (ES) | 0.93621457 |
| Normalized Enrichment Score (NES) | 1.5161494 |
| Nominal p-value | 0.004140787 |
| FDR q-value | 0.31679115 |
| FWER p-Value | 0.987 |
| PROBE | DESCRIPTION (from dataset) | GENE SYMBOL | GENE_TITLE | RANK IN GENE LIST | RANK METRIC SCORE | RUNNING ES | CORE ENRICHMENT | |
|---|---|---|---|---|---|---|---|---|
| 1 | EIF4G2 | 3800575 6860184 | 94 | 1.497 | 0.2053 | Yes | ||
| 2 | EIF4A2 | 1170494 1740711 2850504 | 110 | 1.416 | 0.4036 | Yes | ||
| 3 | EIF5 | 6380750 | 149 | 1.296 | 0.5838 | Yes | ||
| 4 | EIF4G3 | 670707 | 247 | 1.035 | 0.7240 | Yes | ||
| 5 | EIF4A1 | 1990341 2810300 | 460 | 0.798 | 0.8248 | Yes | ||
| 6 | EIF2S2 | 770095 2810487 | 867 | 0.556 | 0.8811 | Yes | ||
| 7 | EIF4G1 | 4070446 | 1073 | 0.470 | 0.9362 | Yes | ||
| 8 | EIF4E | 1580403 70133 6380215 | 3698 | 0.039 | 0.8007 | No | ||
| 9 | EIF2S1 | 5360292 | 6772 | 0.003 | 0.6360 | No | ||
| 10 | EIF5B | 1190102 4200440 | 9213 | -0.003 | 0.5053 | No |